Many-body effects play an important role in low-dimensional electronic systems, and because of their interaction with the honeycomb topology, they have attracted great attention in the field of graphene physics. Although the theoretical treatment of interactions in graphene usually assumes that the system is clean and controllable, these prerequisites are difficult to meet in natural materials. Two-dimensional (2D) saddle-point excitons (redshifted from the saddle-point singularity at point M) in graphene have significant many-body effects, but their optical response is much lower than the relevant energy range for device applications. Artificial graphene (AG) is a controllable platform for simulating quantum behavior in 2D crystal physics. The AG system with adjustable honeycomb lattice is suitable for exploring the quantum conditions of the many-body effect in the graphene-like ribbon structure.
However, the electron-electron interaction in solid-state AG has not yet been reported, especially for GaAs-based AG, which is mainly difficult to achieve low disorder conditions for observing this effect.
Recently, Lingjie Du (corresponding author) of Columbia University and others published a research paper entitled "Emerging many-body effects in semiconductor artificial graphene with low disorder" in the well-known journal Nature Communications. The article reported that the high mobility of GaAs quantum A low-disorder semiconductor AG is implemented on the well (QW).
The researchers prepared a small-period triangular anti-point lattice to significantly suppress the influence of processing disturbances on electrons, thereby maintaining a high-quality state on the grown QWs. This achievement makes it possible to observe the collective saddle-point spin excitons subject to exchange Coulomb interactions. The observed Coulomb exchange interaction energy is equivalent to the energy gap of the Dirac band at point M, which indicates that the quasi-particle interaction and AG Interaction between potential energy.
Observing the collective saddle-point spin excitons and the relatively large Coulomb interactions in the low-disordered AG lattice indicate that the electron-electron interaction effect is the dominant system in AG. The many-body effect that is not available in graphene.
Figure 1: Low-disorder artificial graphene in a triangular anti-point lattice
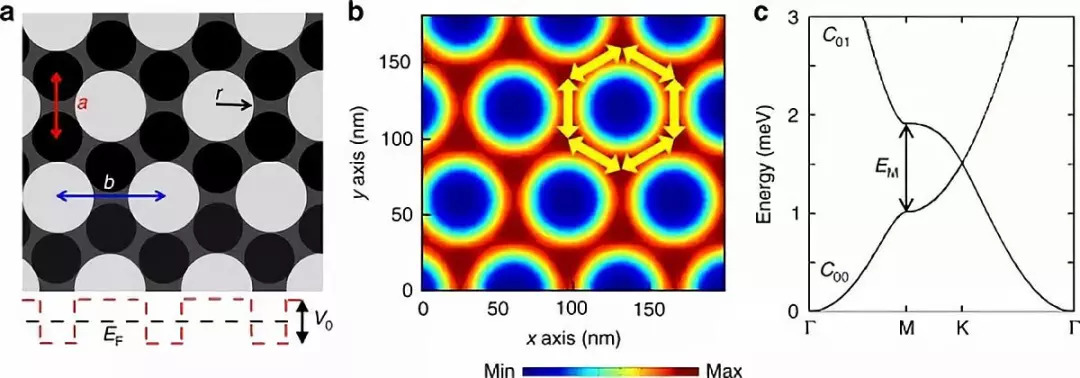
(A) Schematic diagram of the triangular anti-dot lattice with period b printed on the GaAs quantum well. The white circle represents the etched anti-dot with radius r, the black and gray areas represent the unetched area, and the black circle represents the period a =b/√3 effective point of the honeycomb pattern arrangement. In evaluating the AG band structure, we use the pill box potential with Fermi energy (red dashed line) in the single particle approximation. V0 is the potential depth of the etched area. Each anti-point will produce an effective repulsive potential V0 (b) The electron density calculated in the triangular anti-point lattice, where V0=6 meV, b=70 nm, a=40.4 nm and r=20 nm, highlighted by the yellow arrow In order to strengthen the electronic coupling between the closest points, the color bar represents the two lowest Dirac bands with the parameter AG in the electron density (c) b, and EM represents the band gap value near the M point
Figure 2 Artificial graphene prepared in a triangular anti-point lattice
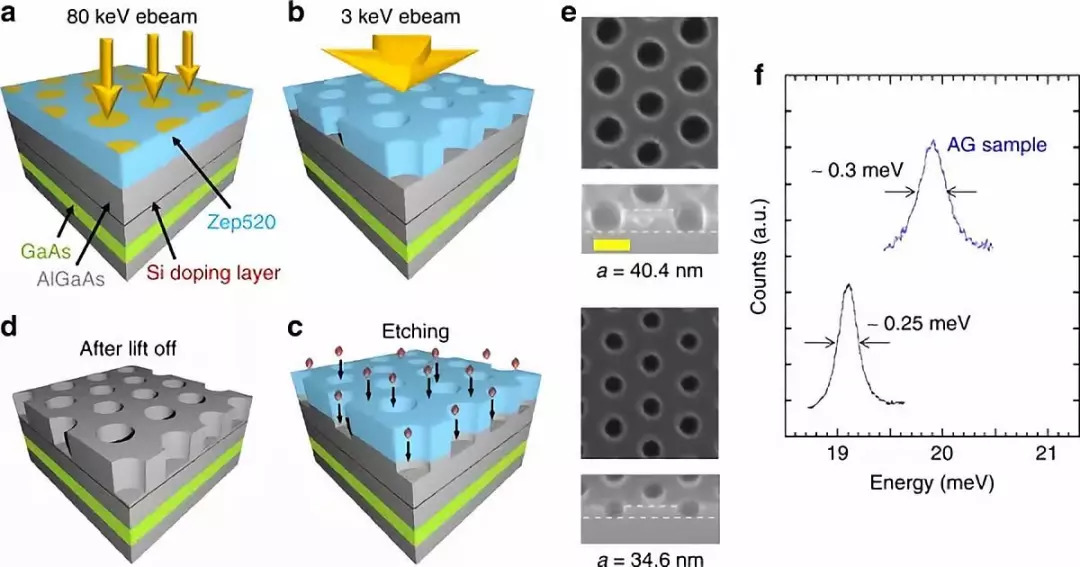
(A) Zep 520 resist is exposed to an accelerating voltage of 80 kV through an electron beam, after which the resist evolves into a triangular anti-dot pattern
(B) The patterned resist is exposed to 3 kV accelerating voltage through electron flooding to enhance the chemical stability of the resist
(C) The BCl3-based dry etchant is used to transfer the pattern to the substrate in a depth-controlled method
(D) The final device after removing the residual resist. The QW is located at 80 nm below the surface and 30 nm of the δ-doped layer of Si. The electron density grown is 2.1×1011cm-2, and the Fermi level is 7.5 meV, low temperature mobility is 106cm2V-1s-1
(E) Scanning electron microscope pictures of AG lattices with different periods at 0° tilt (top panel, top view) and 40° tilt (bottom panel, side view), the yellow ruler on all panels is 50 nm
(F) Between the RILS spectrum of the inter-subband excitation of AG sample I (the incident photon energy is 1554.36 meV, the blue mark) and the inter-subband excitation of the grown GaAs QW (the incident photon energy is 1550.92 meV, the black mark) For comparison, for different incident photon energies, the peak width of the inter-subband excitation of sample I is almost constant, and the spectrum is taken under cross polarization at 5 K
Figure 3 Dirac band excitation of low disordered AG in triangular anti-point structure
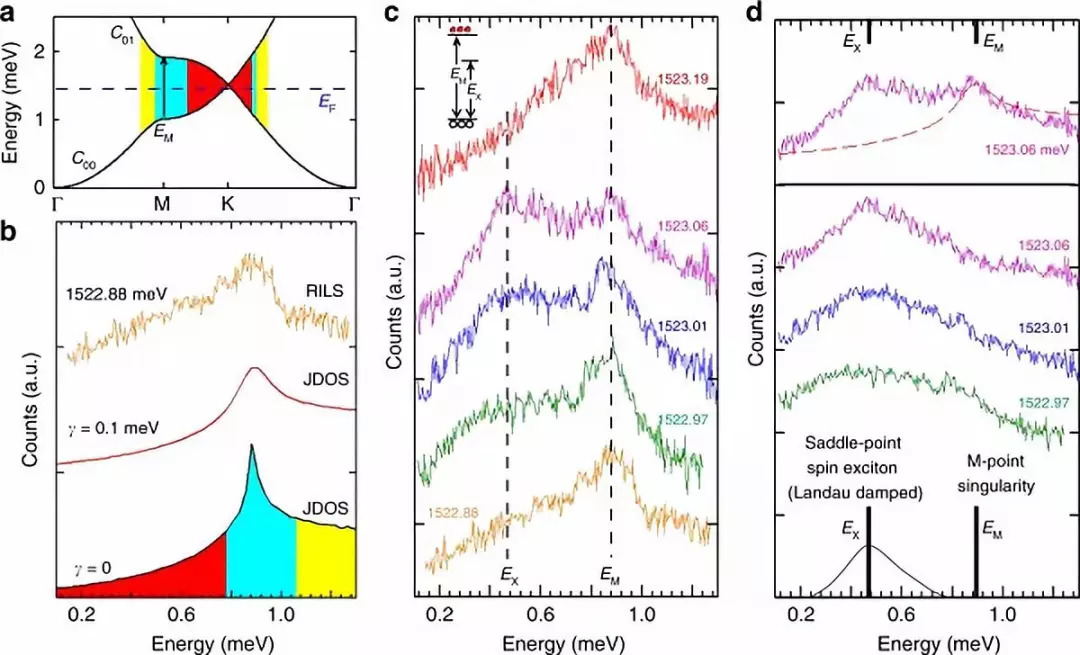
(A) The energy band calculated by AG and the Dirac transition diagram of sample I, using different colors to represent the transitions in different environments
(B) The lowest curve is the joint density of states (JDOS) of the transition in a, the color area indicates the transition in different environments, the red mark is the JDOS under Gaussian expansion, and the width is γ=0.1 meV (where γ is selected to fit Close to the shape of the spectral line of EM), the yellow trace at the top is the RILS spectrum excited by the Dirac band in sample I, and its incident photon energy ħωi is 1522.88 meV
(C) The RILS spectrum excited by the Dirac band. The non-RILS background is removed. The vertical dashed line indicates the position of EM and EX. The illustration shows the level diagram of EM and EX. In this illustration, the black circle is the empty space of the c00 band. Hole, the red circle is the electron in c01
(D) The top represents the RILS spectrum, ħωi is 1523.06 meV, JDOS (red dashed line, γ=0.1 meV) is proportional to the scattering intensity caused by single-particle excitation, bottom: the upper trace represents the single-particle JDOS intensity after subtracting The spectra of ħωi are 1523.06 meV (purple), 1523.01 meV (blue) and 1522.97 meV (green). The schematic diagram shows the spin exciton energy and band gap energy at point M. Due to Landau damping, spin excitation Increased sub-model width
Figure 4 Detecting Coulomb exchange energy in inter-subband excitation
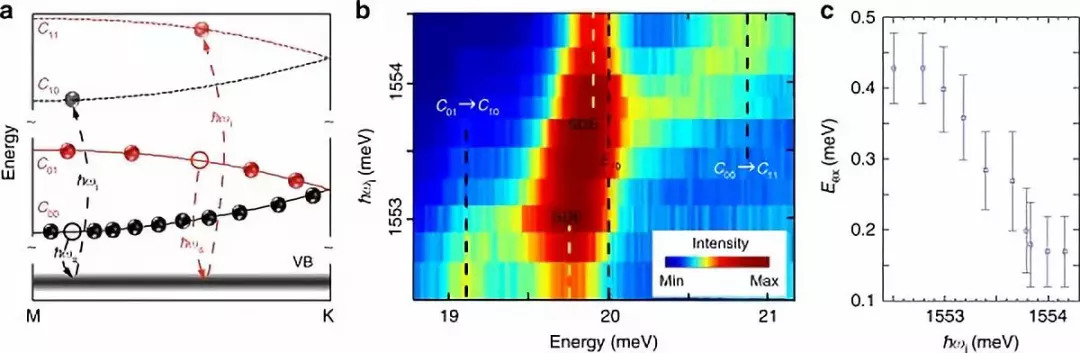
(A) Represents the optical transition of RILS in spin density excitation (SDE) between subbands. In the transition with incident photon energy ħωi, the incident photon excites an electron from the valence band (VB) to the c11/c10 state , Leaving a hole in the valence band; in the transition with scattered photon energy ħωs, the electron in the c10/c00 state will recombine with the hole to emit scattered photons; the incident photon energy ħωi and the scattered photon energy ħωs pass Energy conservation is related to E=ħωi- ħωs, where E is the excitation energy of the AG under study. In SDE, electrons are excited from the lower filled AG subband to the next higher subband without changing the AG band index, red The (black) line defines the SDE excited electronic state through the spin flip processing from c01 and c11 (from c00 and c10) under the higher (lower) ħωi. When the c01 band is higher than the Fermi level, because our experiment is There is thermal excitation of carriers at a finite temperature, so it is filled. (b) The color map of the RILS spectrum is a function of the measured ħωi in the temperature T=5 K with cross polarization. The color bar represents the scattered light Intensity, c01→c10 and c00→c11 marked by the dashed line represent the energy combined with the transition between subbands and the change between the quantum well subband and the AG band index. The dashed line marked E10 represents the position of the quantum well subband spacing. The yellow dotted line indicates the position of SDE. There is weak photoluminescence overlapping with the transitions of c01→c10 and c00→c11, and the exchange energy of SDE (c) which depends on ħωi extracted from (b). The vertical error bar represents the measured spectrum Uncertainty of estimation of E10 and ESDE in
The low-disorder AG realized in the paper reveals the existence of collective terahertz saddle-point spin excitons at the singularity of the state density M point. Low-disorder AG is a highly tunable condensed matter system that can be used to study graphene-like physics, in which the interaction between the electronic interaction and the hexagonal topological state of the AG lattice is dominant. The research findings may open up new methods for studying strongly correlated quantum states (ferroelectricity and non-traditional superconductivity) in condensed matter systems, and expand the toolbox of quantum simulation. Since saddle-point excitons are in the terahertz range and are affected by adjustable parameters, low-disorder AG can provide a semiconductor platform for optoelectronic device applications.

The 60W Macbook Charger with MagSafe1 or Magsafe 2 Power Adapter has a magnetic DC connector, so if someone trips on it, the power cord disconnects harmlessly, keeping your MacBook Air safe. It also helps prevent the cable from fraying or weakening over time. Additionally, the magnetic DC helps guide the plug into the system for a quick and safe connection.
60W Apple charger usb c,60w charger macbook air,macbook 60w charger
Shenzhen Waweis Technology Co., Ltd. , https://www.huaweishiadapter.com