The spectrum analyzer is a widely used tool in the testing of fiber-optic communication systems. This article focuses on the AQ6370 model and explains various methods for measuring common parameters using this device. By combining practical applications, it provides an overview of how to effectively utilize a spectrum analyzer in optical communication testing.
I. Introduction
Spectrum analyzers play a crucial role in optical communication systems, especially in wavelength division multiplexing (WDM) applications. Initially, they were primarily used to measure signal wavelengths and optical signal-to-noise ratios (OSNR). These instruments are known for their large dynamic range—typically up to 70 dB—and high sensitivity, reaching as low as -90 dBm. Additionally, they offer a small resolution bandwidth, often less than 0.1 nm, making them ideal for OSNR measurements. The wavelength range typically spans from 600 nm to 1700 nm. However, compared to multi-wavelength meters, their wavelength accuracy is not as precise.
Some popular models include the Yokogawa AQ6376 and the Anritsu MS9740A. These devices can be used to measure a variety of parameters, such as the spectrum shape, power levels at different reference points, OSNR per channel, gain coefficients of optical amplifiers, and gain flatness. Modern spectrum analyzers also come with integrated WDM analysis software, allowing users to easily view key parameters like center frequency, power, and OSNR for each wavelength in a WDM system.
II. Testing Common Parameters
The display of a spectrum analyzer shows measurement settings, marker values, other data, and the waveform. Below is a breakdown of the screen components:
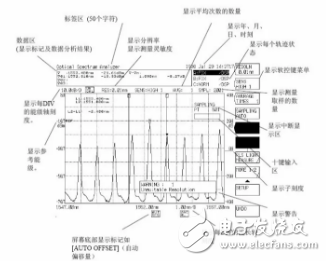
Figure 1: Screen layout of the spectrum analyzer
2.1 Measuring Spectral Width
Spectral width refers to the bandwidth of a light source's spectrum. It can be measured for both laser diodes (LDs) and light-emitting diodes (LEDs). When measuring spectral width, it’s essential to consider the resolution of the spectrum analyzer. Ideally, the resolution should be less than 1/10 of the signal's spectral width. In practice, it's recommended that the resolution be set to at least 1/5 of the actual value to ensure accurate results.
In real-world applications, the resolution bandwidth is usually set to 0.1 nm or lower. This setting can be found in the first item under the "SETUP" menu, where you can directly input the desired resolution bandwidth. As shown in Figures 2, 3, and 4, changing the resolution bandwidth significantly affects the observed spectral shape and the measured spectral width.
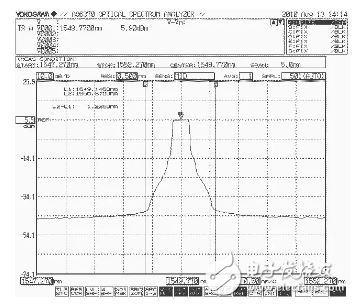
Figure 2: Spectral shape at RES = 0.5 nm
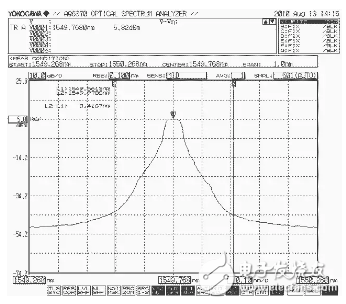
Figure 3: Spectral shape at RES = 0.1 nm
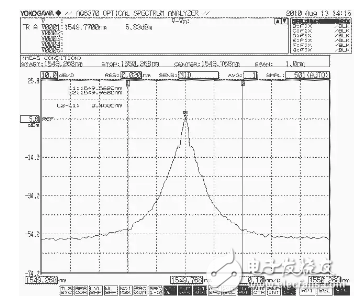
Figure 4: Spectral shape at RES = 0.02 nm
While observing the spectral width, the spectrum analyzer also allows users to read additional parameters such as the center frequency, bandwidth, peak power, and side-mode suppression ratio. Using the MARKER menu, you can easily identify and measure specific values, making the process more efficient and accurate.
110KV, 220KV Oil-resistant Heat-shrinkable Tubing
110KV, 220KV oil-resistant heat-shrinkable tubing
110KV, 220KV oil-resistant heat-shrinkable tubing,Heat-shrink tube,Heat shrinkable tubing,thermal contraction pipe,Shrink tube
Mianyang Dongyao New Material Co. , https://www.mydyxc.com