 Recently, the National Energy Administration announced the use of electricity in the entire society from January to October. The data shows that the total social power consumption in October was 379.7 billion kWh, an increase of 11.35% year-on-year. It is similar to the average growth in the previous October. Data show that from January to October, the country’s entire society used 389.51 billion kWh of electricity, an increase of 11.87% year-on-year.
 Among them, the primary industry's electricity consumption was 87.2 billion kwh, an increase of 4.38%; the secondary industry's electricity consumption was 299.08 billion kwh, an increase of 12.16%; the tertiary industry's electricity consumption was 425.2 billion kwh, an increase of 13.62%; the life of urban and rural residents The electricity consumption was 473.7 billion kwh, an increase of 10.10%.
CEC’s analysis believes that the consumption of electricity in the tertiary industry and urban and rural residents in October significantly reduced the chain’s electricity consumption in the entire society. The growth rate of electricity consumption in light industry continued to be significantly lower than that in heavy industry, and the average daily electricity consumption in the manufacturing industry. The volume has declined, and the electricity consumption in the four key industries has remained high.
According to the data, the four key industries of chemicals, building materials, ferrous metal smelting, and non-ferrous metal smelting used a total of 130.3 billion kWh of electricity in October, a slight increase from the previous month; an increase of 15.5% year-on-year, contributing to the growth in electricity consumption of the entire society. The rate was 45.2%, mainly due to the base of the same period of last year.
In terms of different industries, the electricity consumption in the chemical industry has been stable at about 30 billion kWh for seven consecutive months, and the electricity consumption has increased by 22.2% year-on-year. The growth rate has continued to increase since May; the electricity consumption of the building materials industry has been stable for seven consecutive months. About 26 billion kWh, an increase of 18.0% over the same period of last year; the ferrous metal smelting industry electricity consumption increased by 14.2% year-on-year, and the amount of electricity used in each month this year was maintained at 44 to 47 billion kWh; the electricity consumption of the non-ferrous metal smelting industry was already For the sixth consecutive month, it stabilized at about 30 billion kwh, and electricity consumption increased by 9.0% year-on-year.
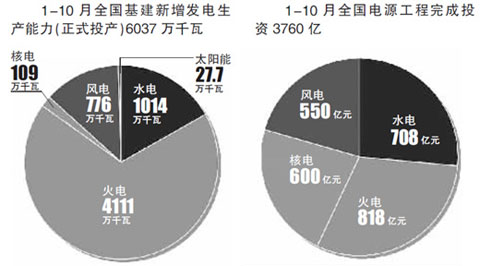
New start of thermal power decreased by 49.4%
The negative growth of hydropower output from the National Energy Administration shows that from January to October, the cumulative average utilization of power generation equipment in the country was 3,971 hours, an increase of 60 hours over the same period of last year. Among them, the average utilization hours of hydropower equipment was 2,639 hours, down 379 hours; the average utilization hours of thermal power equipment was 4,391 hours, an increase of 214 hours.
The loss status of thermal power industry directly reflects the start-up scale. CEC statistics from January to October, the country's new start-up power generation installed capacity decreased by 13.2 million kilowatts over the same period of last year, of which the new start-up of thermal power decreased by 14.43 million kilowatts over the same period of last year, a decrease of 49.4% year-on-year. At the end of October, the scale of thermal power projects under construction decreased by 21.22 million kilowatts from the same period of last year, a year-on-year decrease of 24.9%.
The CEC believes that the capacity of power generation equipment and thermal power equipment capacity of 6000 kilowatts and above have increased by 10.5% and 9.1% respectively year-on-year, which is lower than the growth of power generation and thermal power generation by 1.8 and 5.2 percentage points in January-October, respectively. The growth of supply capacity has been consistently lower than the increase in power generation output, and the impact on the balance of power supply and demand in the future will gradually emerge. The growth of installed capacity in the region is quite different. The growth of installed capacity in most of the eastern and central provinces is slow, which is obviously lower than the growth rate of electricity consumption.
Thermal power is subject to coal, and hydropower is subject to rain. The average utilization hours of hydropower equipment in the country was 379 hours lower than the same period of last year and it was the lowest level in the same period since the “Eleventh Five-Year Plan†period. In October, the country’s hydropower output was 50.1 billion kWh, a year-on-year decrease of 15.2%, a decrease of 5 percentage points from the previous month; from January to October, the cumulative hydropower generation nationwide was 517.5 billion kWh, a year-on-year decrease of 2.2%.
The CEC report believes that hydropower generation in the provinces with relatively large hydropower installed capacity in the South, Central and East China regions has decreased significantly, and the hydropower production situation in winter is not optimistic.
The cross-regional transmission plays a prominent role. From January to October, the national trans-regional transmission of electricity reached 142.2 billion kWh, a year-on-year increase of 19.7%, and the growth rate was basically the same as the same period of the previous year; of which, the trans-regional transmission of electricity was completed in October was 13.7 billion kWh, which was the same Increased by 20.6%.
Overall, in October, the role of cross-district lines in supporting power-constrained areas is still prominent. For example, the power supply in Central China where supply and demand in the northwest is tight (North China to Central China) increased by 42.6% year-on-year, and the northwest to Shandong and Sichuan respectively completed 2.16 billion kilowatts. Hours and 1.06 billion kwh; North China sent to East China (Yangcheng to Jiangsu) increased by 86.7%. However, affected by the decline in hydropower output, the amount of electricity sent from Central China dropped by 32.8% year-on-year, including a drop of 15.4% to East China and a decrease of 29.4% to the south. In addition, the northeast sent to North China decreased by 5.9% year-on-year.
From January to October, China Southern Power Grid “West Power Transmission to the East†was 87 billion kilowatt-hours, which was a year-on-year decrease of 6.8%. Affected by the low water supply, the power supply in July, August, September and October decreased by 10.2%, 23.4%, and 21.3% year-on-year respectively. And 41.5%, has been negative for four consecutive months. From January to October, the total input power of the Beijing-Tianjin-Tangshan power grid was 30.2 billion kWh, which was a year-on-year decrease of 5.0%; the power output to Hebei and Shandong power grids was 1.26 billion kWh and 18.3 billion kWh, respectively, an increase of 69.3% and 22.5% year-on-year respectively.
From the perspective of the growth of electricity consumption in each region, the provinces in which electricity consumption increased by more than the national average (11.87%) year-on-year were: Xinjiang (28.40%), Ningxia (24.64%), Inner Mongolia (20.88%), Jiangxi ( 19.06%), Qinghai (18.88%), Yunnan (17.47%), Hainan (16.34%), Fujian (16.14%), Chongqing (15.79%), Gansu (14.71%), Shaanxi (14.51%), Sichuan (13.29% ), Anhui (12.62%), Guizhou (12.45%), Shanxi (12.43%), Guangxi (11.92%).
Battery Charger,Solar Charger,Travel Charger
Motorcycle Battery Co., Ltd. , http://www.nscyclebattery.com